

ROPS Testing and the RM Asia testing protocol
As a critical and integral part of Brown Davis Automotive's research and development process, each ROPS design is analysed to confirm its load performance. Combining the test methods of both computer based analysis as well as physical testing, Brown Davis have a stringent testing regime which is inline with the best standards in the world. This ensures the ultimate in ROPS design and quality, giving a measured performance level of safety with certified documentation for OH & S and risk management.
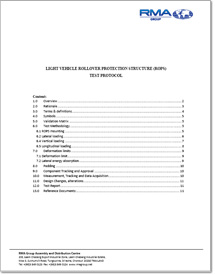
The Brown Davis testing process and load performance requirements have been developed around the the specific testing criteria for mining vehicles as set out by RM Asia, one of the worlds largest fleet supply organisations. In the absence of a realistic world mining ROPS standard, RM Asia contracted a specialist engineering team to research all worldwide roof crush strength data and documentation to develop a testing protocol document (See test protocol document attached below). This protocol insists on static physical testing only to achieve critical test loads, and gives repeatable real world results which are not attainable in dynamic roll over testing. More of the worlds leading engineers working in this area and government regulatory bodies are now focusing towards static testing over dynamic roll over tests, due to the countless variables inherent in dynamic testing. For repeatable results, and a standard that one can genuinely compare one rops structure to another, physical testing is the only measure.
Finite Element Analysis (FEA)
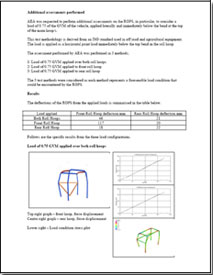
Finite Element Analysis (FEA) offers a detailed visualisation of where ROPS structures bend or twist, indicating the distribution of stress. This allows designs to be created, optimised and finalised in 3D before the design is manufactured. FEA in ROPS creation has become a very useful tool, with its ability to allow insight into real world outcomes prior to destructive testing of actual prototypes. The resulting stress and deformation can be measured for simulated rollover loads from nearly any axis, and therefore each component and structure can be re-designed or modified accordingly, until an effective computer model meets the load levels Brown Davis Automotive deem acceptable.
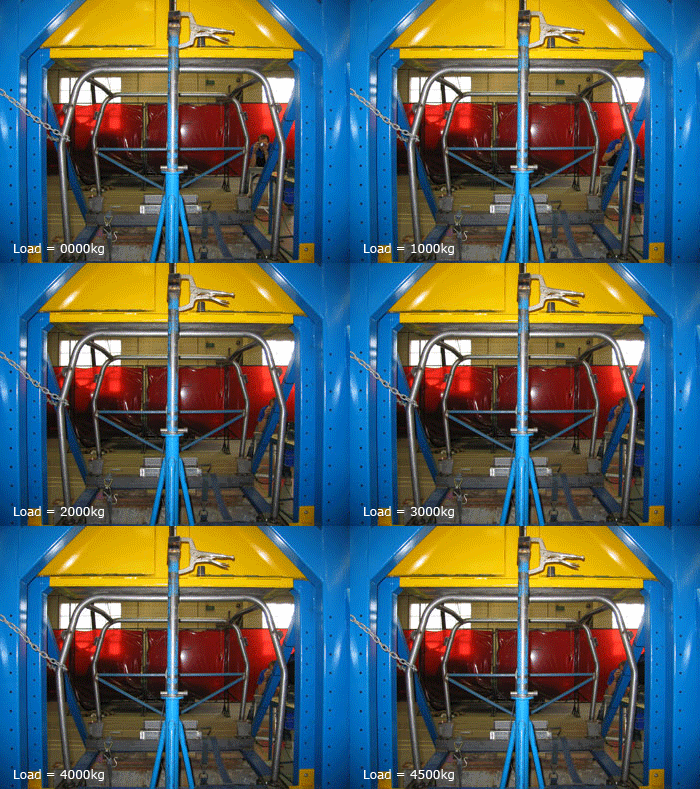
Brown Davis incorporates both physical (destructive testing), as well as computer based analysis. Physical testing is carried out to confirm FEA results and substantiate the computer model. Complex motorsport ROPS produced by Brown Davis Automotive have been compared against FEA models and revealed a result within 5% (FIA approval cannot be issued without such FEA proof for ROPS in motorsport).
It is this combination of critical data that enables very efficient progress of each design, and ultimately produces a superior product, providing the maximum roll over protection achievable.
Each ROPS design produced by Brown Davis Automotive comes with an independent third party consultant engineering report, completed by one of the leading specialists in the field. (Click the report page below to view Ford Ranger ROPS Report to see an example)

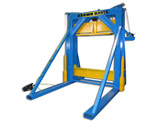
Brown Davis ROPS Physical Testing


©Brown Davis 2009 - www.browndavis.com.au


